


The dashboard presents the GSA Index and the public summary of the Global System Assessment (GSA): the level of structural pressure, systemic category, and configuration of the international system for the assessment cycle.
|
Systemic category
Critical convergence
|
GSA Index
4.15 / 5
|
Cycle date
October 21, 2026
|
| Configuration Multiple convergence, not yet synchronized | ||
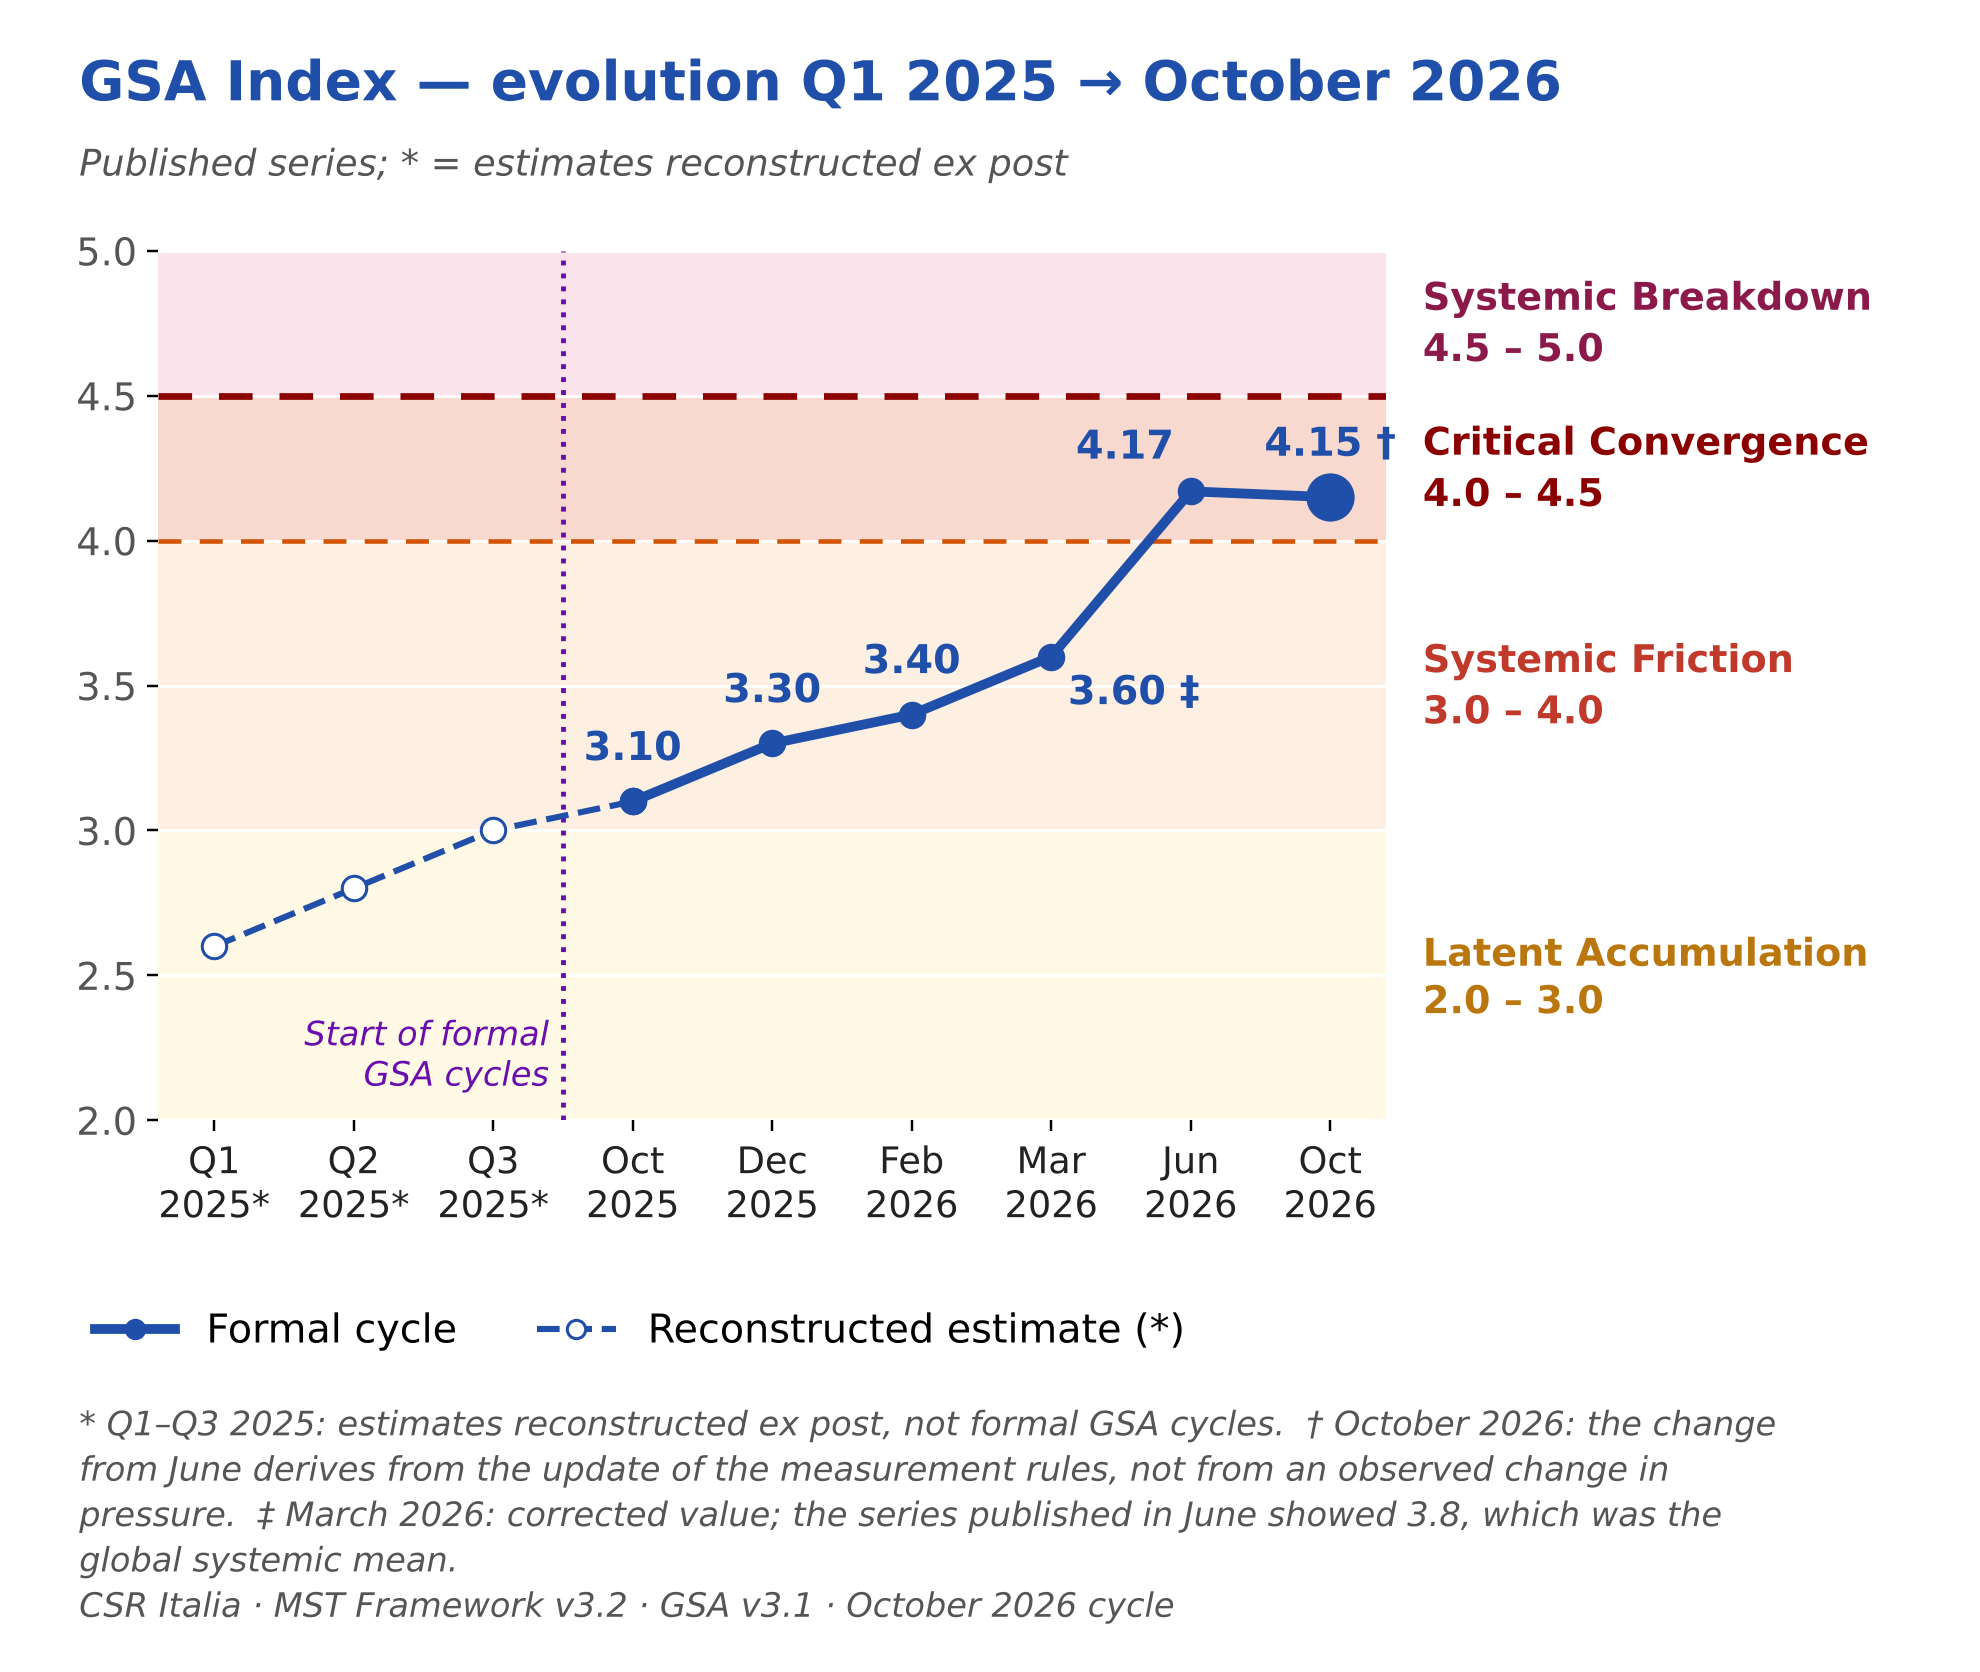
In the October 2026 cycle the international system remains in Critical Convergence, at the highest levels of structural pressure since formal monitoring began: eight of the nine macro-areas are still simultaneously in the critical band.
The GSA Index summarizes the overall structural pressure of the international system on a scale from 1 to 5. It does not predict specific events, but represents the system’s overall configuration for the assessment cycle.
GSA Index Scale – Structural Categories
| 1.0 – 2.0 | Sustainable pressure | Contained tensions, ample adaptive capacity, limited cross-domain propagation. |
| 2.0 – 3.0 | Latent Accumulation |
Rising pressures that are not yet consistently convergent; adaptive capacity remains robust. |
| 3.0 – 4.0 | Systemic friction | High and persistent pressures across multiple domains; progressive erosion of adaptive capacity. |
| 4.0 – 4.5 |
Critical convergence OCTOBER 2026 CYCLE |
Simultaneous alignment of pressures across multiple macro-areas; significant reduction in containment capacity. |
| 4.5 – 5.0 | Systemic Breackdown |
Critical synchronization with propagation that cannot be contained at the global level. |
GSA Index trajectory
|
Q1 2025*
2,6
|
Q2 2025*
2,8
|
Q3 2025*
3,0
|
Oct 2025
3,1
|
Dec 2025
3,3
|
Feb 2026
3,4
|
Mar 2026 ‡
3,6
|
Jun 2026
4,17
|
Oct 2026 †
4,15
|
† The difference from June derives from the update of the measurement rules, not from an observed change in pressure.
‡ Corrected value: the series published in June showed 3.8, which was the global systemic mean, a different quantity from the index.
* Q1–Q3 2025: reconstructed ex post estimates, not formal GSA cycles.
Reading of the current configuration
The October 2026 configuration — multiple convergence, not yet synchronised — is the same as in June: almost all the world's main macro-areas remain simultaneously under high structural pressure, but the crises are not aligned in a way that would produce a global systemic breakdown.
The cycle records new tensions: the reopening, from mid-July, of the front between Saudi Arabia and the Houthis, with attacks on commercial shipping in the Red Sea, and the resumption of fighting in Tigray from August. However, they added to areas already at maximum pressure: the scores and categories of the nine macro-areas remain unchanged. The slight difference in the index from June, from 4.17 to 4.15, derives from the update of the measurement rules and not from lower pressure.
| Two macro-areas — the Middle East and Eastern Europe — remain at the top of the scale: Systemic Breakdown. In the MST framework, Systemic Breakdown is a level above Critical Convergence: it indicates a condition in which internal compensation mechanisms are insufficient to contain structural pressure. Of the remaining seven macro-areas, six are in Critical Convergence; the Arctic remains in Systemic Friction. |
The cross-cutting pressure on logistics and energy corridors, described below, also remains active: it does not act as a localised crisis, but reduces the overall absorption margin of the system.The failure to move into Systemic Breakdown does not derive from a reduction in tensions: the index remains below the breakdown band and the pressures, although linked, are not synchronised across the system's different areas and domains.
Why This Is Not Systemic Breakdown
In the current cycle, three structural conditions prevent a move to the higher category:
— The index remains below the systemic breakdown band. At 4.15 out of 5 the system is in the 4.0 – 4.5 band. Only the Middle East and Eastern Europe are in Systemic Breakdown: a third area would be necessary, but would not be sufficient on its own.
— Pressures are not synchronised. Energy, financial and security pressures are high and interconnected, but the new tensions of the cycle belong to distinct chains of events and do not propagate together across several areas.
— The system's average adaptive capacity remains above the critical threshold. The main structural pivots — first and foremost the European Union — continue to perform a partial compensatory function, with reduced margins.
What would change the category
Toward Systemic breakdown
▶ An increase in pressure taking the index into the 4.5 – 5.0 band, with a third area at the level of those already in breakdown
▶ Prolonged interdiction of the Gulf energy corridors propagating simultaneously to financial markets and regional security
▶ Deterioration of the compensatory capacity of the main regional stabilisers
Towards a reduction in pressure:
← Cessation or significant reduction of at least one of the two high-intensity conflicts (Ukraine or the Middle East)
← Stable restoration of energy and trade flows through the Gulf and the Red Sea
← Recovery of adaptive capacity in the most exposed areas, particularly South Asia
`Active Cross-Cutting Pressures`
| In the October 2026 cycle the international system is still crossed by a cross-cutting structural pressure that is not localised in a single macro-area: a network of critical logistics and infrastructure corridors — through which energy, trade and global strategic mobility flow — is under simultaneous stress in several regions of the world. This pressure does not act as a localised crisis but as an amplifying factor: it reduces the overall absorption margin of the system and increases each area's sensitivity to negative developments in the others. Persistent effects are documented in six of the nine macro-areas. |
Cycle Deep Dives
The systemic configuration of the cycle can be explored through the following levels of analysis:
— Global System Assessment (GSA) – October 2026 cycle
Restricted analytical document. In-depth analysis of the configuration, convergence factors, and the role of individual macro-areas.
— Geopolitical Macro-areas dossier
The regional dynamics that shape the systemic configuration. Middle East · Eastern Europe · United States · South Asia Africa · EU · Indo-Pacific · Latin America · Artic
— MST Framework Architecture
How macro-area assessments are constructed: domains, metrics, adaptive capacity, convergence, and Macro Score.
METHODOLOGICAL NOTE
This Dashboard provides the public summary of the Global System Assessment (GSA) produced in the October 2026 cycle, with evidence as of 14 October and validation on 21 October 2026.
The assessment derives from the application of the Multi-System Tension (MST) Framework v3.2 developed by CSR Italia.
The GSA Index is not a forecast of specific events, but a measure of the overall structural configuration of the international system in the cycle considered.
Some cross-cutting components monitored by CSR were not updated in this cycle and are not included in the measurement; their exclusion does not mean that the corresponding pressure has ceased.
CSR Italia · GSA Index 4,15/5 · Oct cycle 2026 · Framework MST v3.2